

VERY PROUD AND VERY THANKFUL
TO BE INCLUDED (AGAIN…!!!) IN
RETHINK RETAIL’S
TOP RETAIL EXPERTS FOR 2024!
MY THANKS FOR THE OPPORTUNITY TO BE
PART OF SUCH AN INSIGHTFUL GROUP!
*********************************************************************************************************************************************
Why is it so damned difficult to forecast demand in the apparel business…???
Why can’t apparel retailers do a better job of seasonal conversion…??? Why do so many apparel retailers have so much unsold seasonal inventory at the end of each season…???
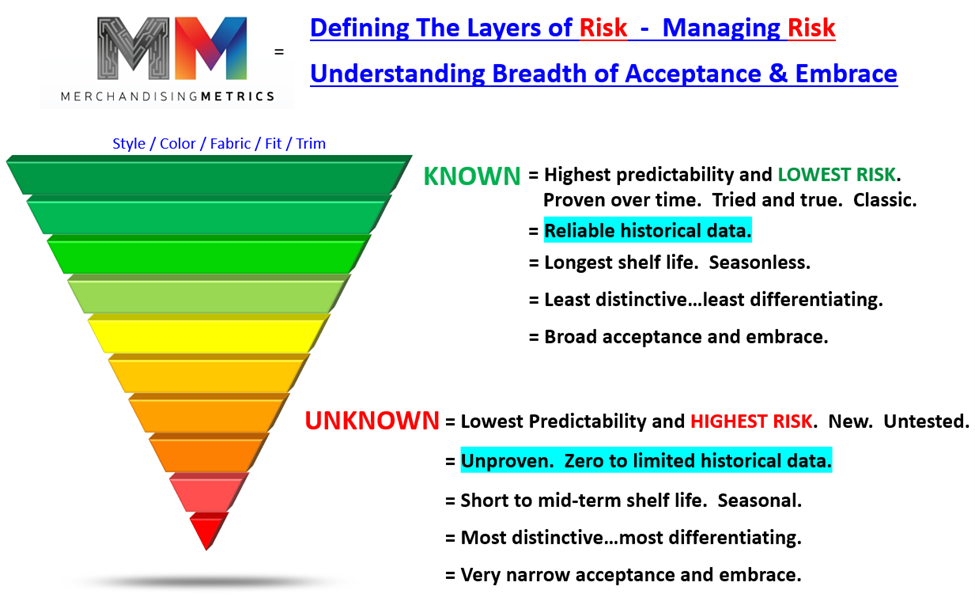
Because data has a shelf life, just like products do.
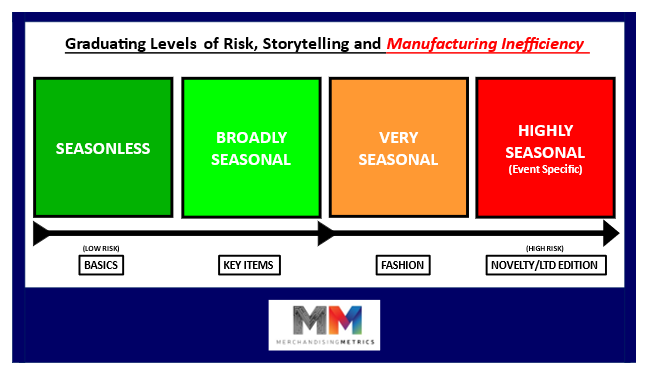
Style-level data on replenishable Basics can accurately predict demand months to a year out. Some style-level data on Seasonal Key Items can predict performance for a full season. And style-level data on Fashion and Novelty products may only be meaningful for several weeks to several months.
Because “seasonal fashion” means change is happening on multiple levels, in multiple locations, continually rendering different parts of your data obsolete.
Seasons change. Fashion changes. Different places need different content at the same moment in time. SEASONAL CONVERSION is incredibly difficult to manage. Solutions that work in Boston during October and November won’t work in Miami. Exit dates are as important as entry dates. Minimizing end-of-season residue inventory is critical to maximizing margin.
Because the Time/Action calendar to reorder already designed product makes it almost impossible to react in-season to early sales trends.
So, an entire season’s worth of inventory must be purchased up front. LY data is going to give pretty good guidance at the category or classification level for projecting an Open-To-Buy number for next year. But projecting demand at the style level on all newly designed products is going to migrate into “guessing” territory very quickly. Known preferences for different color families will provide some guidance, but there are so many other design variables that ranking demand at the style level becomes extremely difficult. That’s the hard truth that needs to be embraced. Enthusiasm is not data. And enthusiasm for freshly designed products is the intoxicant that often leads to over-buying.
OPEN-TO-BUY is the mechanism for a retailer to forecast demand over the full range of their product offering. OTB creates goals and boundaries.
It’s the mechanism for setting realistic goals and establishing boundaries for sales, inventory, turnover and margin. All the number crunching gets bundled up into one very straightforward model. The goal is an ongoing FLOW of 5R content, and that means there are LOTS of moving parts that must mesh WITHIN THE TOTAL.

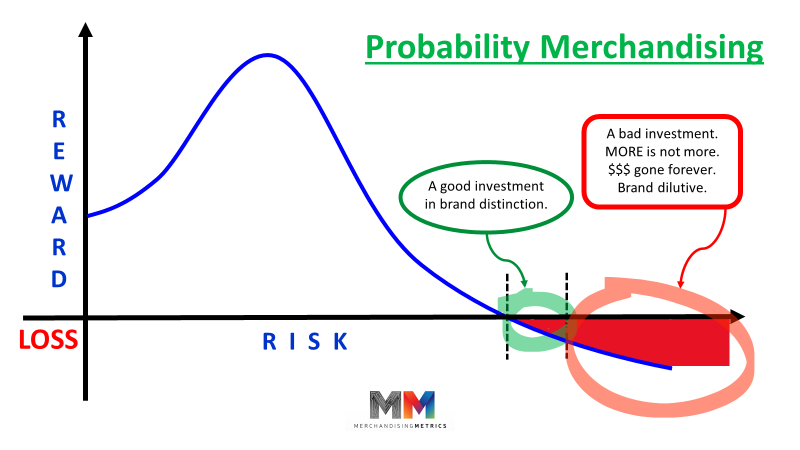
RISKt deserves a seat the table. It has an important role in balancing great storytelling and profitability. RISK is a brand’s best friend.

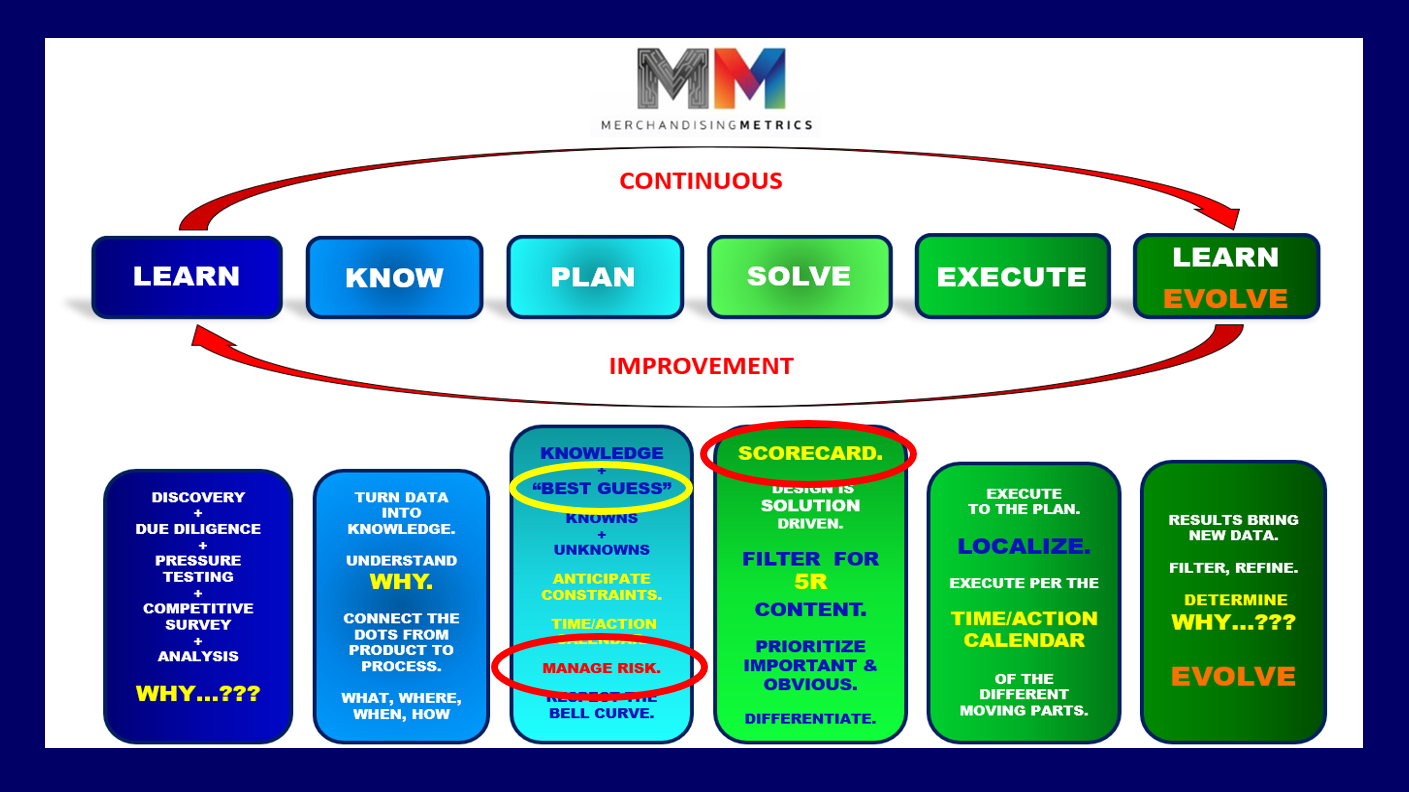
The Merchandising Metrics Process
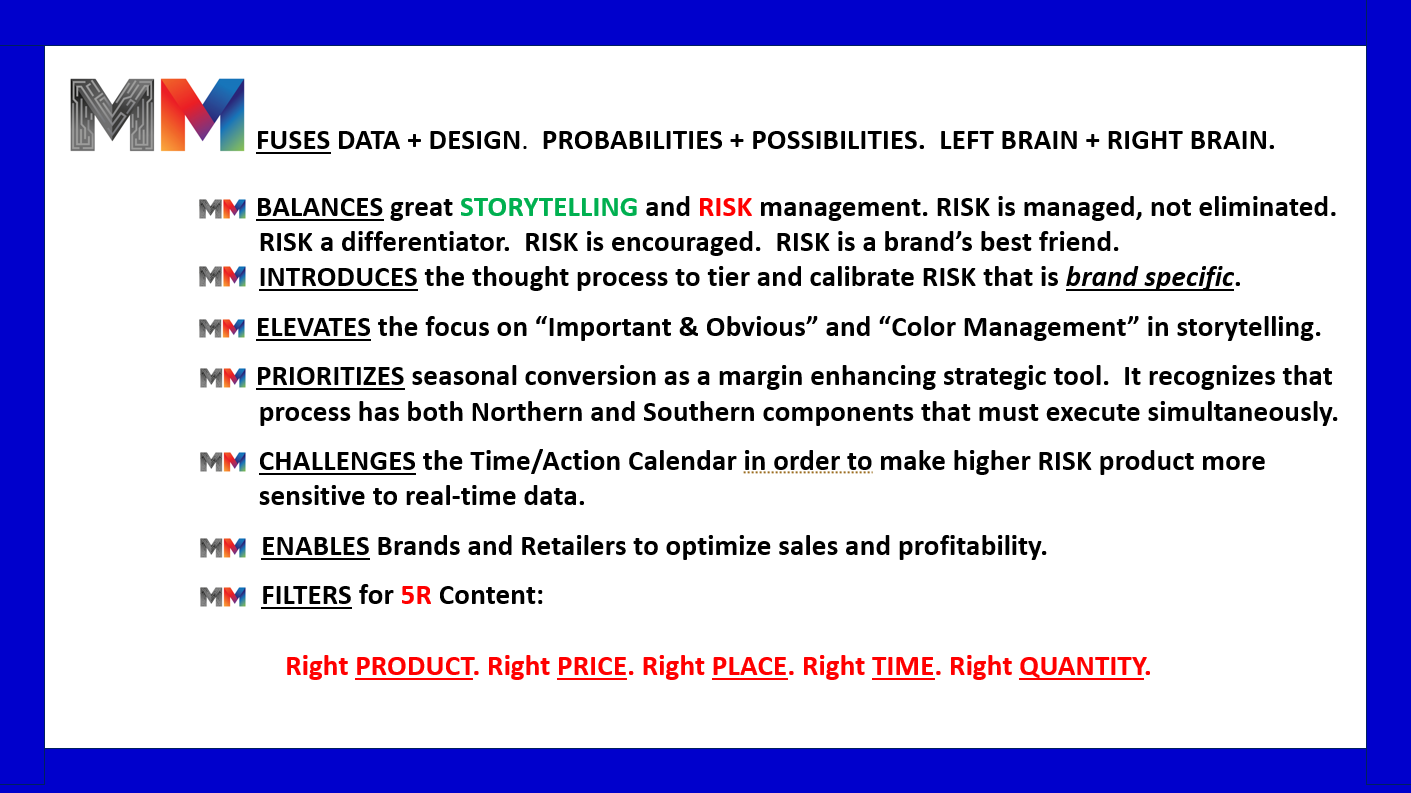
Merchandising Metrics is a compilation of Left Brain + Right Brain thinking that offers analytical and creative solutions to retail and wholesale brands that stretch beyond the scope of traditional thinking. You will learn to look at RISK differently. RISK is to embraced for the differentiation it can give your brand and your business. RISK and differentiation are critical in order to maximize sales and margins in this hyper competitive market.


PROBABILITY MERCHANDISING is a simple idea. How does a retailer, a wholesaler, a brand bend the odds in favor of both great brand story telling while also maximizing the profit potential of the business? Whether it’s called assortment planning, editing or more recently, curating, the process is an intricate interweaving of Left Brain + Right Brain thinking. It is truly Science + Art. It is Logic + Design. MERCHANDISING METRICS can show you the tools and teach you the thinking that will elevate your business.
Your business and assortments are evaluated for fidelity to:
Brand Promise
Risk Profile
Balance between great Storytelling and Profitability
Color Management
Calendar Management & Seasonal Conversion
Space Planning and Optimization
Promotional Depth & Breadth
Creating and Managing Scarcity
The process is rigorous. All the inputs, all the moving parts, all the variables are Pressure Tested and Filtered. Getting to 5R content is not just about Design.
5R = Right Product + Right Price + Right Place + Right Time + Right Quantity.
Last year data, current trend, Risk Mitigation, Color Management, Climate and Seasonal Conversion all play a role.
Probability Planning + Possibility Merchandising
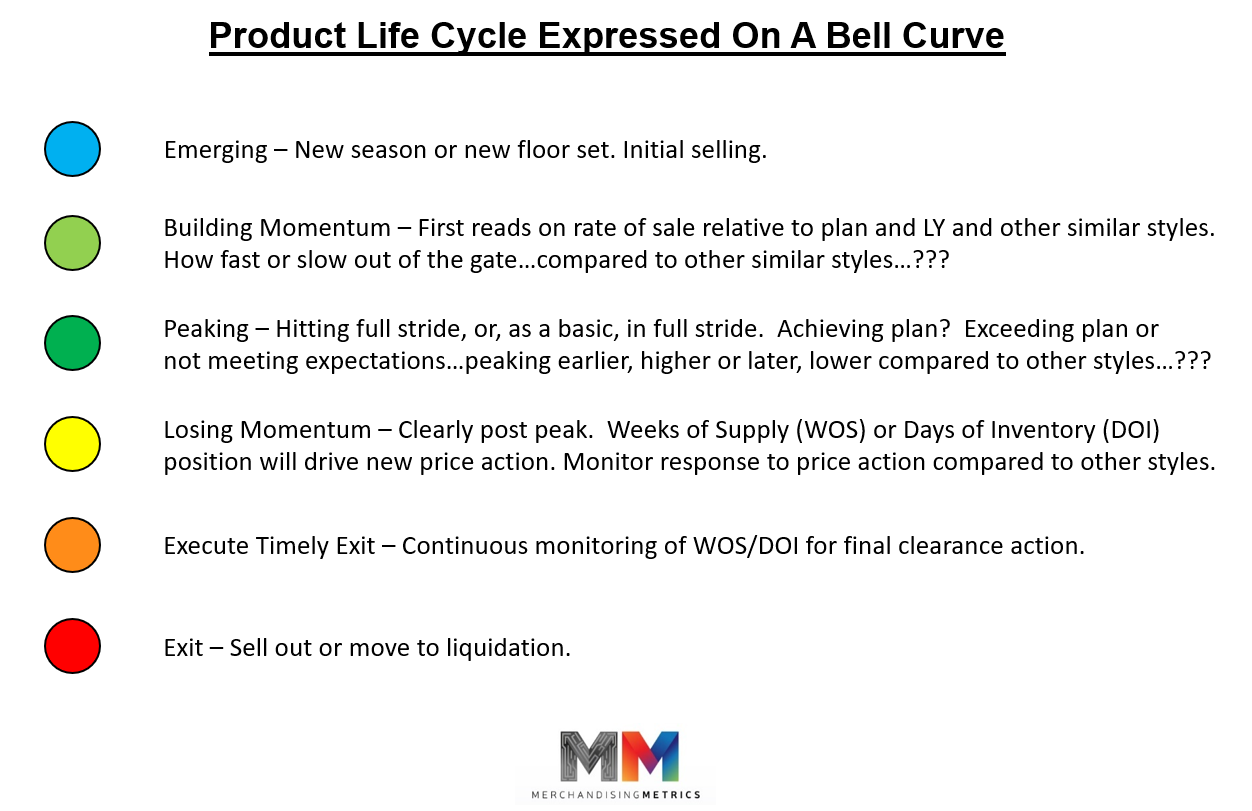
New items, new styles rarely have the good manners to live their life in a neatly balanced bell curve. More often the curve resembles a roller coaster ride. But the 6 phases of life as illustrated below still occur over time. How do you recognize, or maybe even better, how do you define where on the bell curve each individual item is in its life? In apparel, different items or sku’s have different roles. Season Key Items may be designed to live 5-6 months. Fashion or trend items may have a defined life of 1-4 months depending on the level of novelty or seasonality. Re-ordering, allocation and markdown decisions are based on where on the life span curve an item is at a particular moment in time.
*********************************************************************************************************************************************

********************************************************************************************************************************************************************

********************************************************************************************************************************************************************